Product Updates: v2.19.0
NEW FEATURES:
Visualizations Updates:
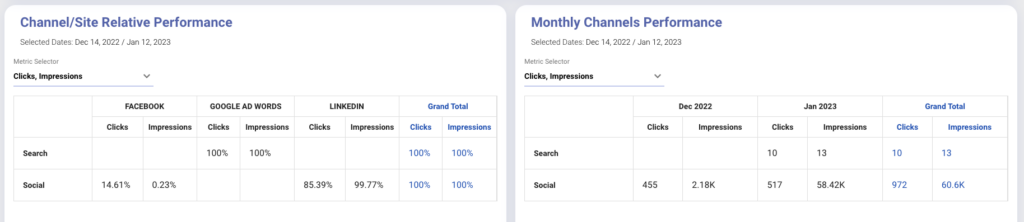
- Added a new Type of Table “Transpose Table” which can be used to create more sophisticated 2D Tables with the needed Dimensions as columns and Rows.
- Visualize the metrics as absolute numbers or as percentages when compared to the Grand totals to suit different needs.
- Also, different variants of Grand Totals are made available for this type of table which will allow aggregating the metrics across rows, columns and even at the table level as a whole.
STABILITY FIXES:
- Graph configurations are now more robustly handled.
- Appropriate date range is always set on widgets based on the Time period selected whenever the filters are applied.
- Fixed some cases when the filter options were not loading while using the data sources from Redshift.
- Any errors encountered during the custom metric saving process will now be presented in a more detailed and descriptive manner.