Product Updates: v2.17.0
NEW FEATURES:
KPI Monitoring System [Beta release]:
A proactive and automated way to monitor KPIs and send notifications based on the boundaries or thresholds that have been set. Find a dedicated section to monitor the alerts that have been setup for various KPIs where we can easily filter them out by the alert name and brand, and also find alerts that you own or have been subscribed to.
There are four types of alerts that are currently available:
- Week-over-week comparison
- Month-over-month comparison
- Rolling Daily Monitoring
- Rolling Aggregated (from the start date provided until the previous day)
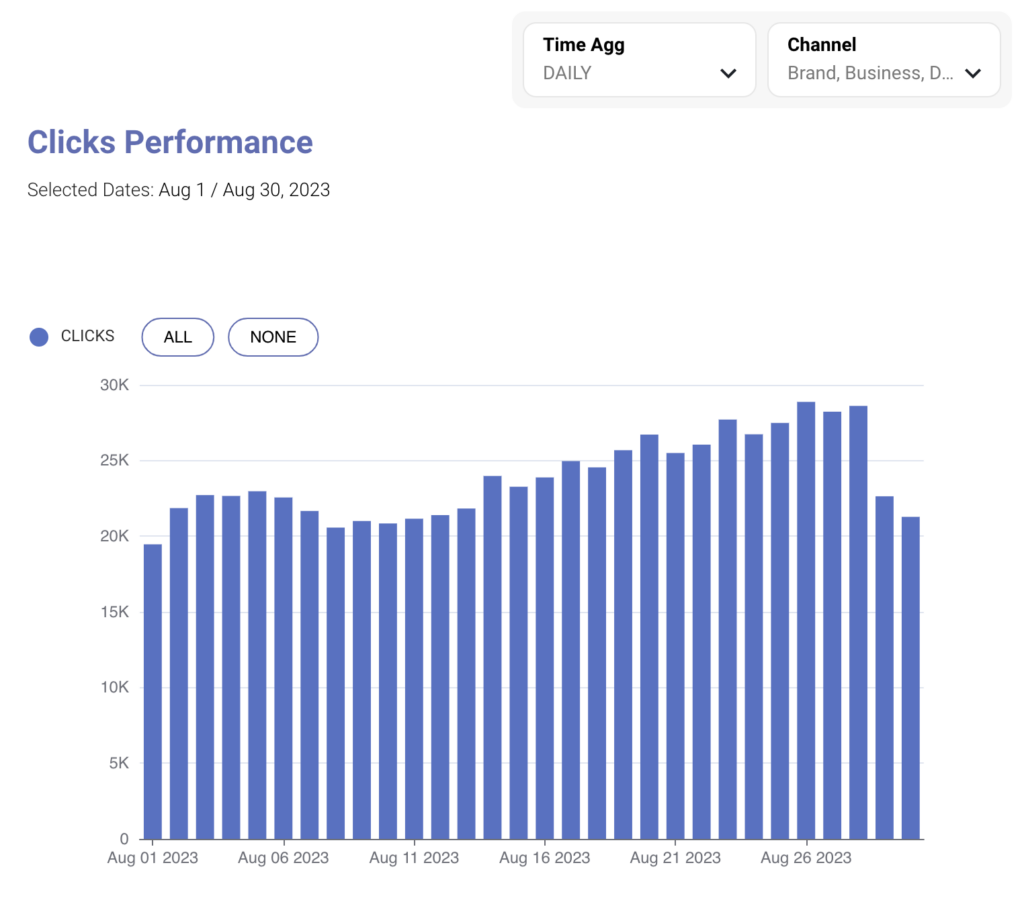
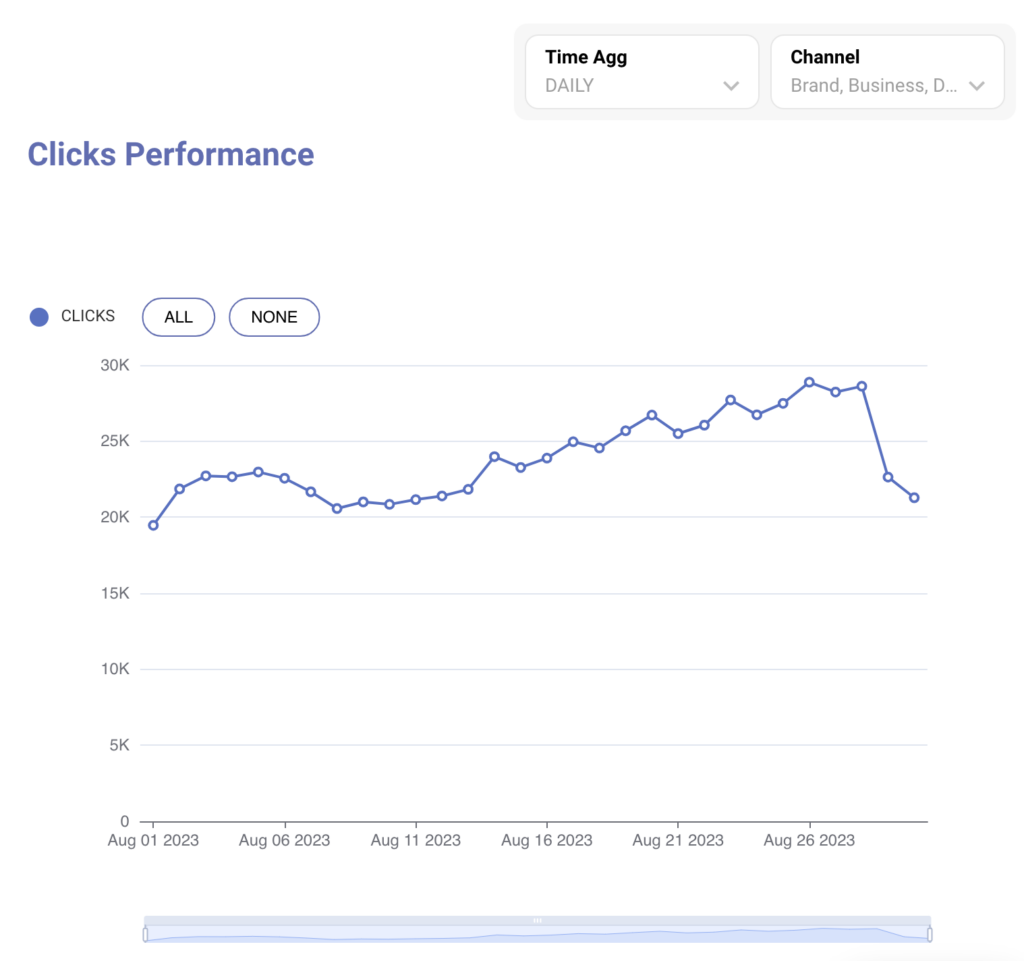
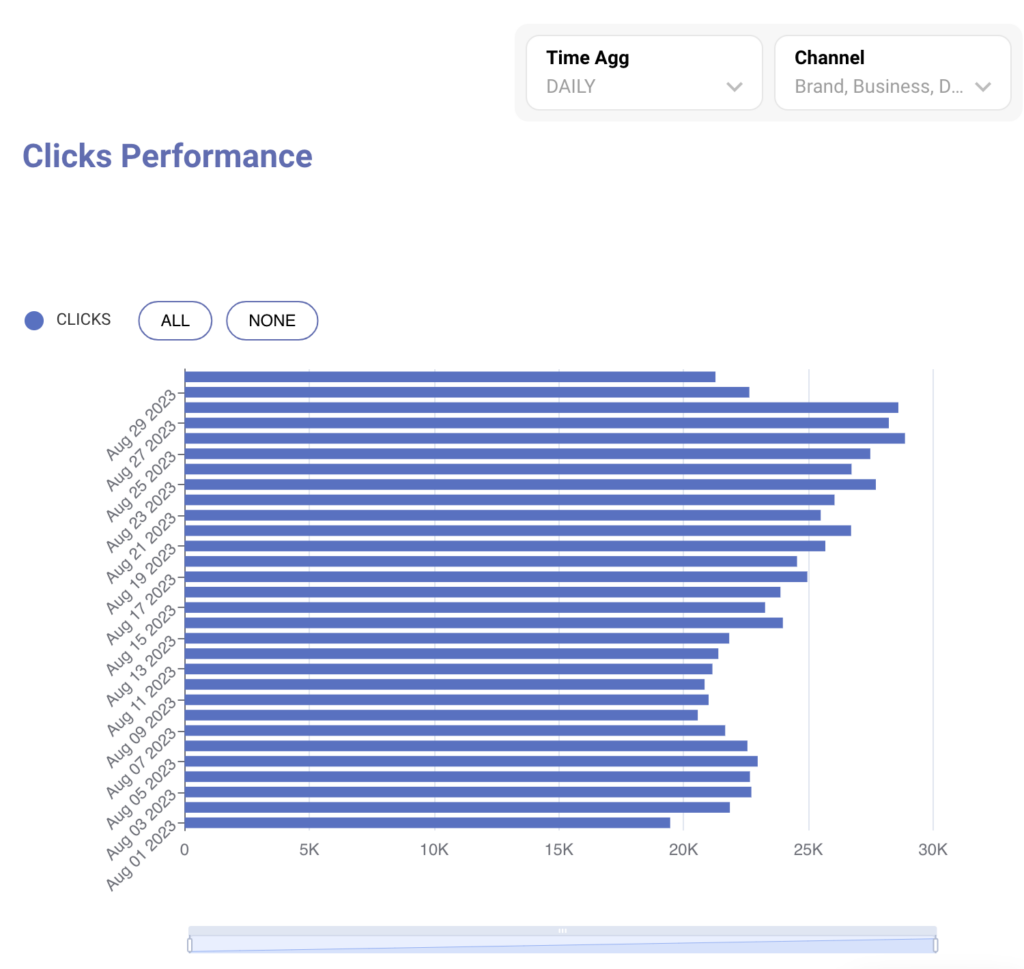
Widget level local filters:
Local filters at a widget level are now extended to individual bar, horizontal bars, and line graphs as well.
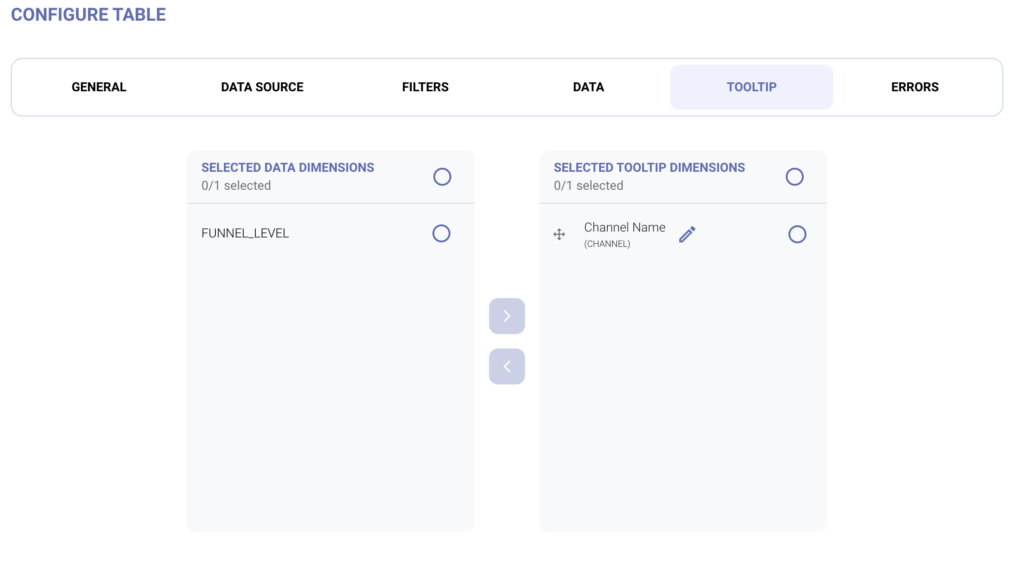
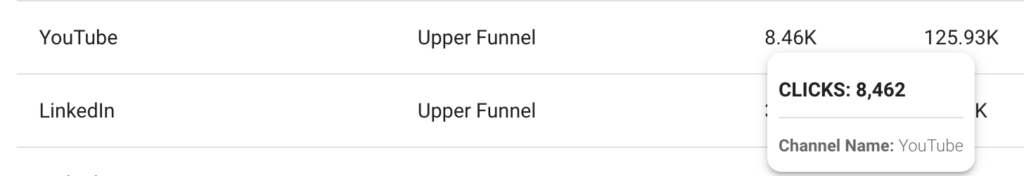
Customisable Tooltip:
- Introduced the ability to show the dimension values in the tooltips for all the metrics in the table.
- Easily select the dimensions to be shown in the tooltip values, rename, and rearrange them as necessary.
- When hovering over any metric value, its corresponding row’s dimension values will be visible in the tooltip as per the set configuration.
MINOR FEATURES UPDATES:
Horizontal bar chart will now allow configuring Date related options in y-axis including Time Aggregation field.
STABILITY FIXES:
Calculation issues in some Custom Metrics resolved along with their compatibility with Redshift datasources have been improved. Enhanced validations for custom date field configuration.
FEATURES IN UPCOMING RELEASES:
New Widget types like 2D Tables for displaying more sophisticated tables. Dual-axis Line and Bar charts will be added.
Local filters will be added to even more charts.