Product Updates: v2.21.0
NEW FEATURES:
Freeform Dashboards (Experimental version):
Create more meaningful dashboards which help you convey better story of your data to the users.
Now, freely resize and rearrange (drag-and-drop) the widgets, and DASH will scale the content to the appropriate size that you set.


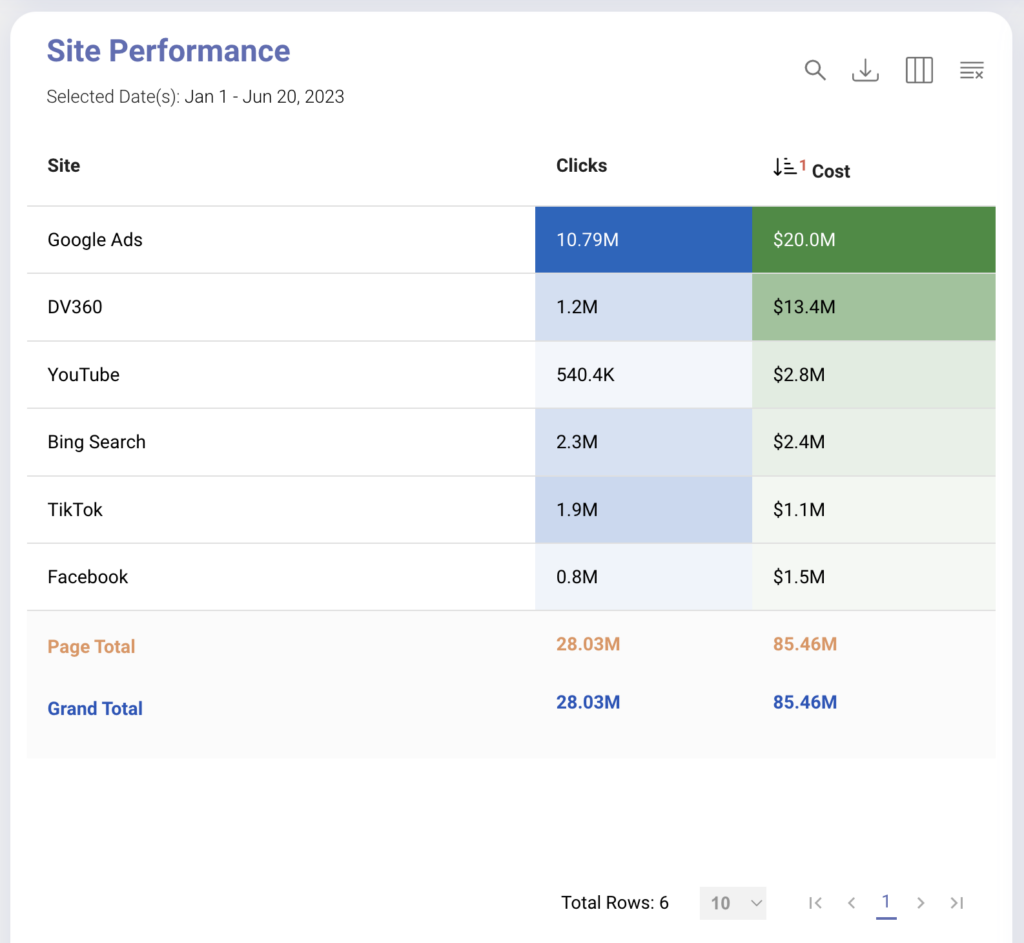
Visualizations Updates:
- Heatmap tables display data using font and background color to identify important numbers, and they present patterns, trends, and relationships within data.
- Users can change any metric from just a number format to heatmap format in the Table widget’s metric configuration.
Weekly Snapshots:
Now, visualize your week level data as well just like how daily level data is ingested and read. This is recommended if the data stored is at a week level.
- Select the Weekly Snapshot type in the Time Period Configuration
- In Default Advanced config, easily select it’s relevant options (Year to Week etc)
- Its support is extended for contextual filters as well.
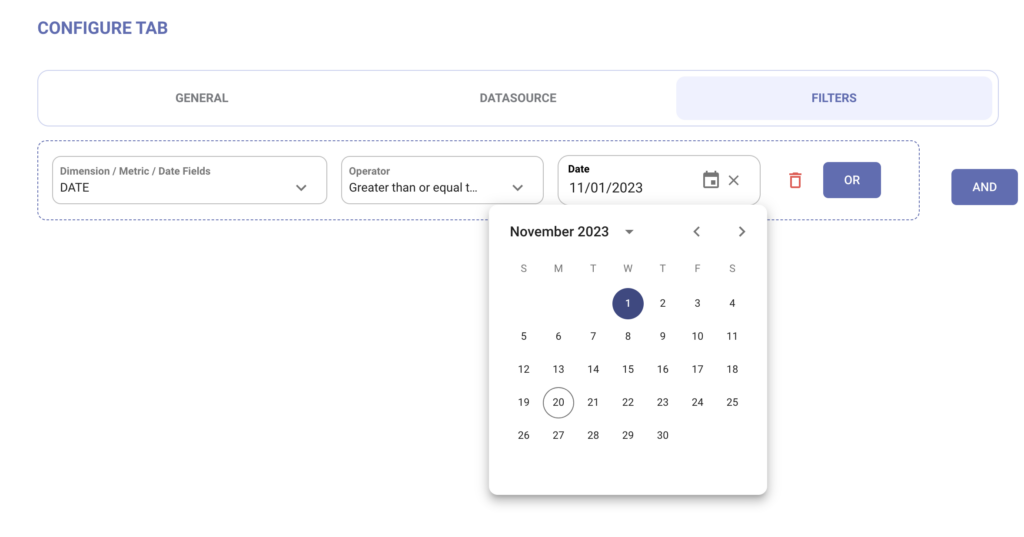
MINOR FEATURES UPDATES:
- Ability to provide source filters even for a date period now, for the Tab as well as at a widget level.
- The Dashboard/Reports listing pages will now be sorted by Updated Date instead of Created Date, making it easier to locate the latest updated pages